I downloaded and installed the latest full-install package, swapped in the latest 32-bit executable (since the 64-bit version is the "main" version these days), and copied in the special color table for RT3 (ELEV_COLORS_0-9999.dbf), and downloaded the GTOPO30 tiles I wanted from the USGS (registering as required). Of course there was the obligatory fumbling around to find some things that had moved since the old version used in the tutorial, but I figured it out well enough. There's just one problem with the output though:
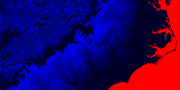
Yep, it's garbage. Even a greyscale map has better precision than that: IrfanView reports only 50 unique colors in the image, and the low
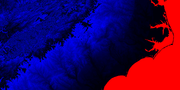
precision is evident when importing the map into RT3. Compare to this MapBuilder heightmap of a roughly similar area, which has 1,700 colors:
I figured this wasn't right, but if there is an option buried somewhere in the program to enable a fuller color depth when using a color table, it eluded me. Anyone know what I missed?
So I decided to try an older version of MicroDEM. The Internet Archive Wayback Machine unfortunately doesn't have any archives of the microdem_setup.exe download dating after October 31, 2001 and before January 9, 2009, so I downloaded the copy from January 2009, uninstalled the latest MicroDEM and installed this one, which turned out to be version 10 build 2008.12.30.1. This version seemed less buggy, but still gave the same low quality output using the special color table. This version expanded the dialog when I selected the table to show a preview of the table, and also gave a "Table > 256 colors" checkbox, but checking this box didn't improve the rendered map.
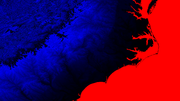
Then I tried swapping in the old "special" executable (version 8.0 build 15.4.12.2) from the ZIP package provided by Wolverine@MSU. It so happens that this version starts up fine with the support files in the version 10 installation, and produced this output:
Much better, right off the bat. It's still visibly inferior to the MapBuilder output though, having only 190 unique colors and looking comparable to a greyscale map of the area. I found that's because the special color table only gives you 1/10 precision, specifying one color for every 10 elevation units. I'm thinking of trying to make higher-precision versions of the color table. Should be easy enough using the series/auto-fill features in Microsoft Excel.